The concepts of bullish and bearish reversal circles are based on the idea of identifying potential reversal zones in the market. Let’s break down the description:
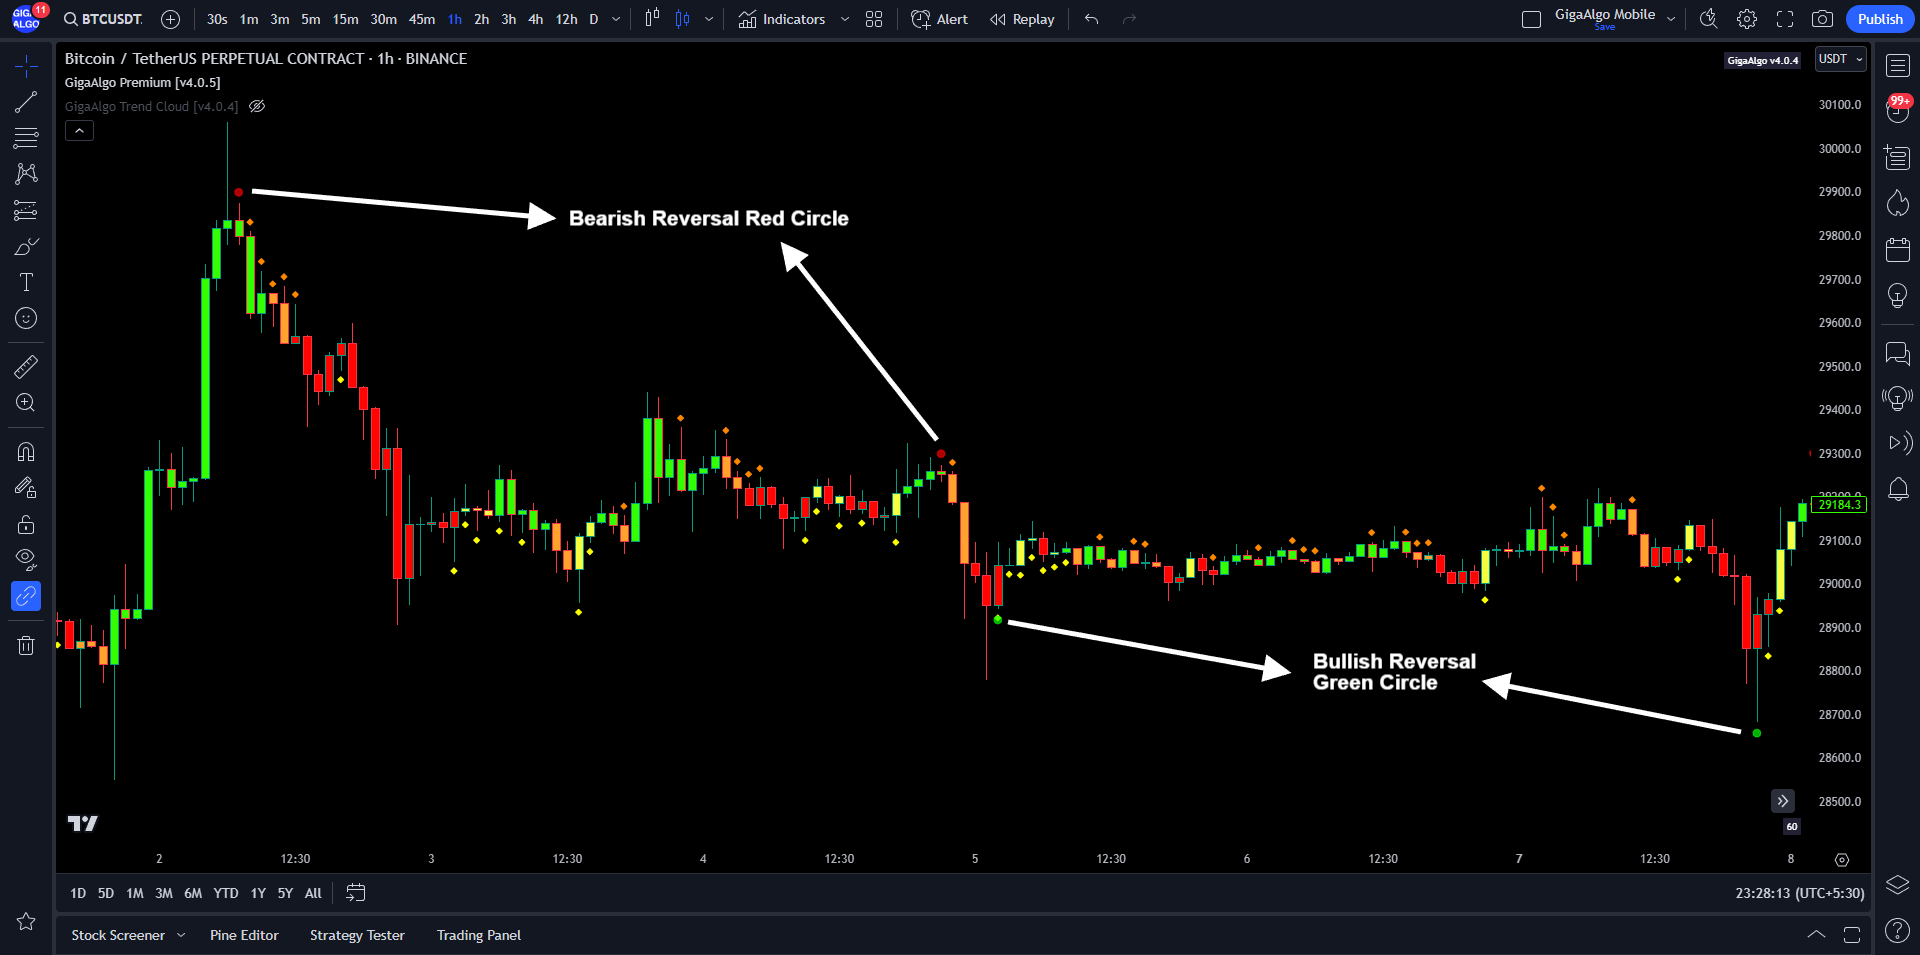
- Bullish Reversal Circle: A bullish reversal circle appears to be a graphical or technical indicator that suggests a potential reversal from a bearish trend to a bullish one. It is triggered when there is an overextended or overbought bearish momentum in the market. This might indicate that sellers have become exhausted, and there’s a possibility that buyers could regain control, leading to a potential bullish reversal.
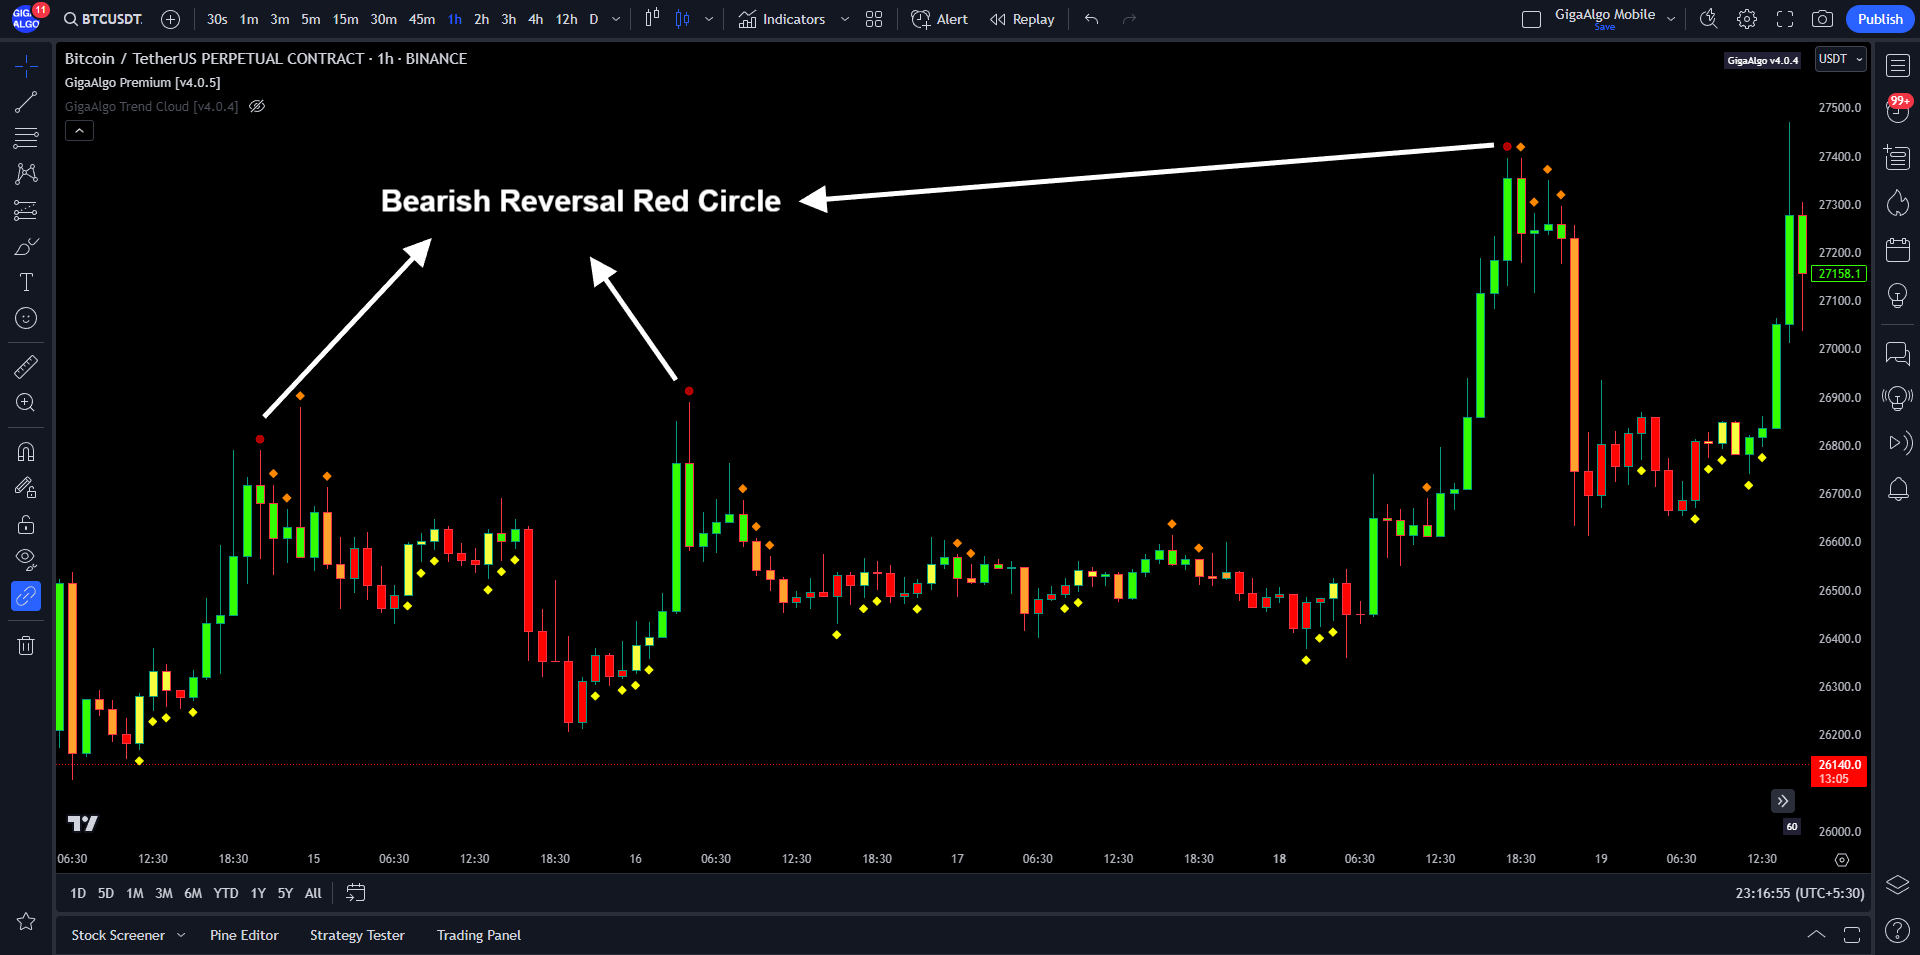
- Bearish Reversal Circle: Conversely, a bearish reversal circle seems to suggest a potential reversal from a bullish trend to a bearish one. It is triggered when there is an overextended or oversold bullish momentum in the market. This could imply that buyers have become exhausted, and there’s a chance that sellers might regain control, leading to a potential bearish reversal.
The idea behind using such circles is to identify points in the market where there is a potential shift in sentiment and trend direction. However, it’s important to note that trading based solely on graphical patterns or indicators can be risky. Traders often use multiple technical indicators and combine them with other forms of analysis, such as fundamental analysis and market news, to make informed trading decisions.
Additionally, traders should employ proper risk management techniques to mitigate potential losses, as no indicator or pattern can guarantee the future direction of the market. These circles can be useful tools, but they should be part of a comprehensive trading strategy and not used in isolation.
Understanding the Bullish and Bearish Reversal Circles:
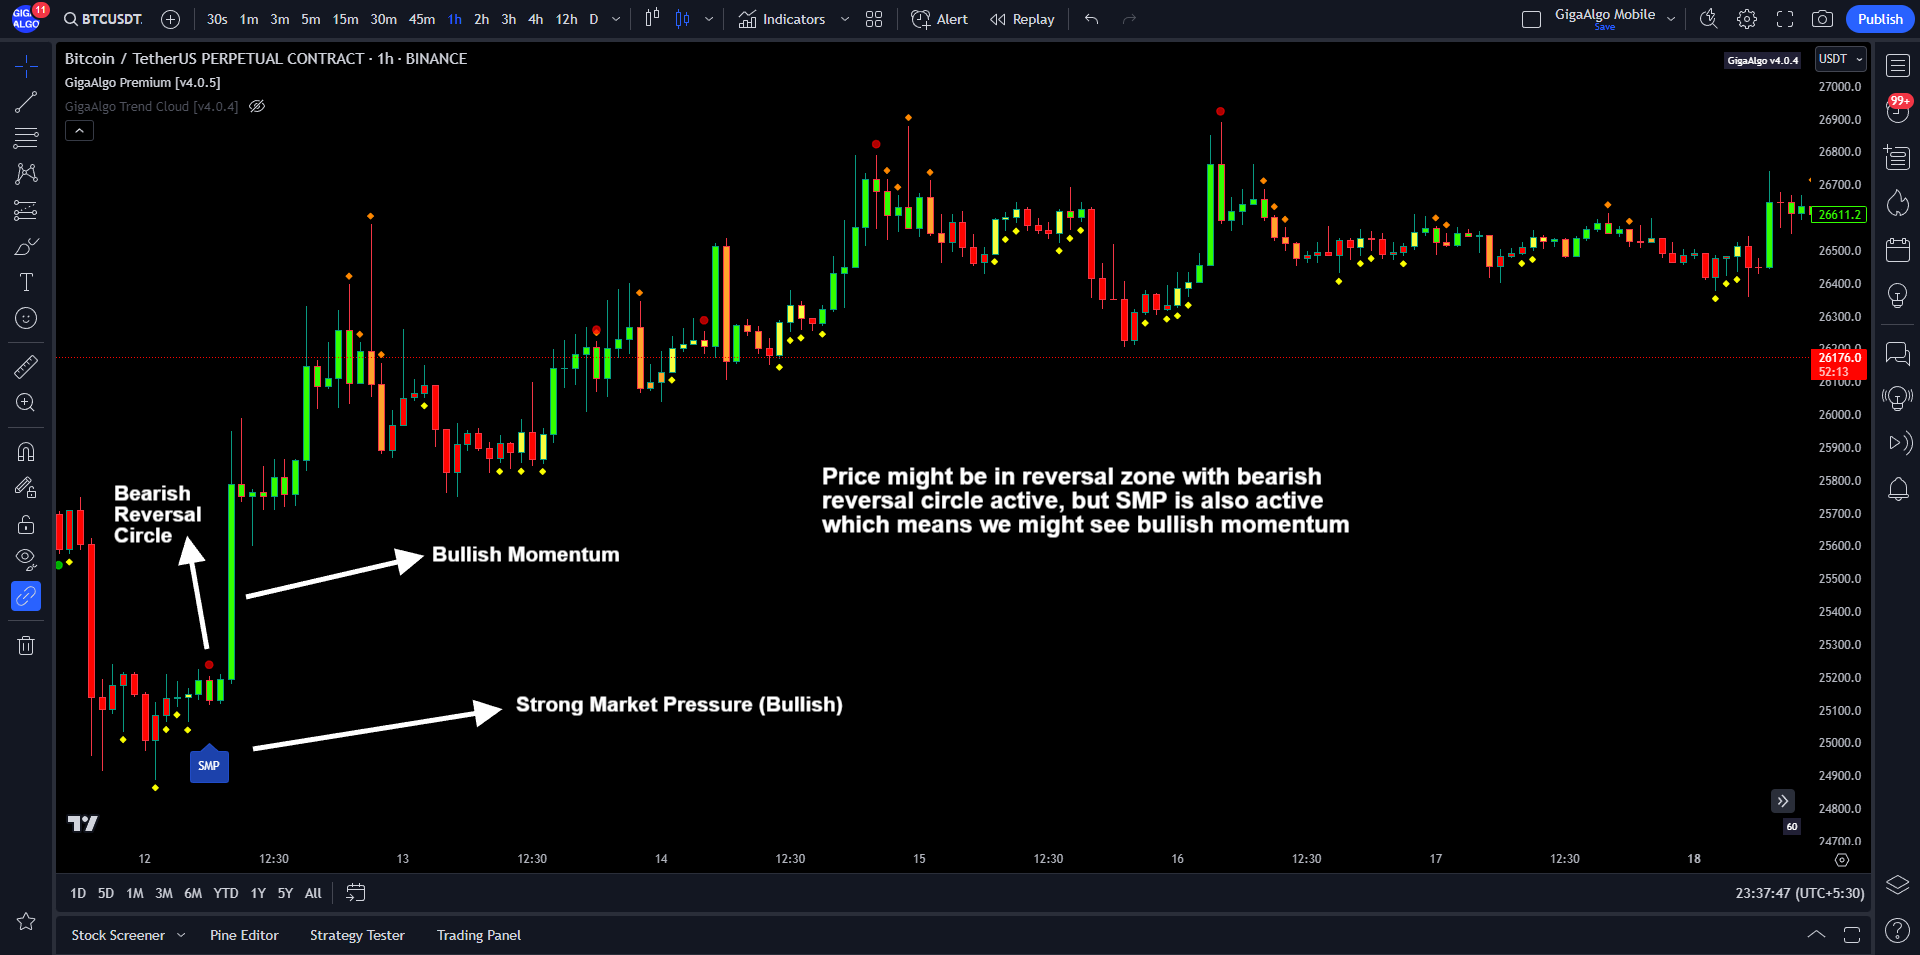
Strong Market Pressure or Sentiment Momentum Price (SMP):
This tool is defined as a trading or technical analysis system that uses two indicators or signals: the “SMP” (Strong Market Pressure or Sentiment Momentum Price) and “reversal circles” to make trading decisions. Here’s how you’ve described these signals:
- Bearish Reversal Circle with SMP (Bullish): When you have a bearish reversal circle (green circle) along with a bullish “SMP” signal (indicated by an upward label), this combination suggests that there might be conflicting signals. The bearish reversal circle indicates a potential bearish reversal, while the bullish SMP signal suggests the possibility of bullish momentum. Traders would need to consider the overall context and potentially exercise caution in such a situation.
- Bullish Reversal Circle with SMP (Bearish): Conversely, when you have a bullish reversal circle (red circle) along with a bearish “SMP” signal (indicated by a downward label), this combination also suggests conflicting signals. The bullish reversal circle indicates a potential bullish reversal, while the bearish SMP signal suggests the possibility of bearish momentum. Traders would similarly need to consider the overall context and exercise caution.
It’s important to emphasize that trading based on conflicting signals can be risky. Traders often use a combination of indicators and signals to confirm or validate their trading decisions. Additionally, they consider factors such as market conditions, news events, and overall trends before making a trade. Risk management is also crucial to protect against potential losses.
The effectiveness of this specific combination of signals (SMP and reversal circles) would depend on the details of your trading system, how well it has been back-tested, and the specific assets and markets you are trading. Traders should thoroughly test their strategies and adapt them to changing market conditions.
Understanding SMP with Reversals: