
The GigaAlgo Oscillator offers various viewers and settings that allow traders to customize their analysis based on different indicators. Here are the options available within the GigaAlgo Oscillator, which can be switched between from within the indicator settings:
- GIGA Oscillator (Default):
- The default GigaAlgo Oscillator provides the primary oscillatory analysis for traders, typically based on a specific calculation or combination of factors.
- GIGA MACD (Moving Average Convergence Divergence):
- The GigaAlgo MACD viewer focuses on the MACD indicator, which is based on the convergence and divergence of two moving averages. It helps traders identify potential trend reversals and momentum shifts.
- GIGA RSI (Relative Strength Index):
- The GigaAlgo RSI viewer is centered around the Relative Strength Index, a momentum oscillator that measures the speed and change of price movements. It aids in identifying overbought and oversold conditions.
- GIGA Stochastic:
- The GigaAlgo Stochastic viewer emphasizes the Stochastic Oscillator, which assesses the relationship between an asset’s closing price and its price range over a specific period. It helps traders pinpoint potential turning points.
- GIGA Impulse:
- The GigaAlgo Impulse viewer focuses on an impulse-based analysis, which may involve custom calculations or signals that highlight rapid price movements and potential trend changes.
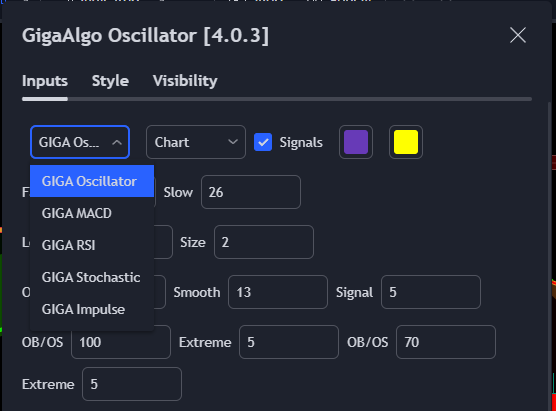
These different viewers and settings within the GigaAlgo Oscillator enable traders to tailor their technical analysis to their specific preferences and trading strategies. Depending on their objectives and the types of signals they seek, traders can switch between these viewers to gain insights into market momentum, trend direction, and potential trading opportunities.
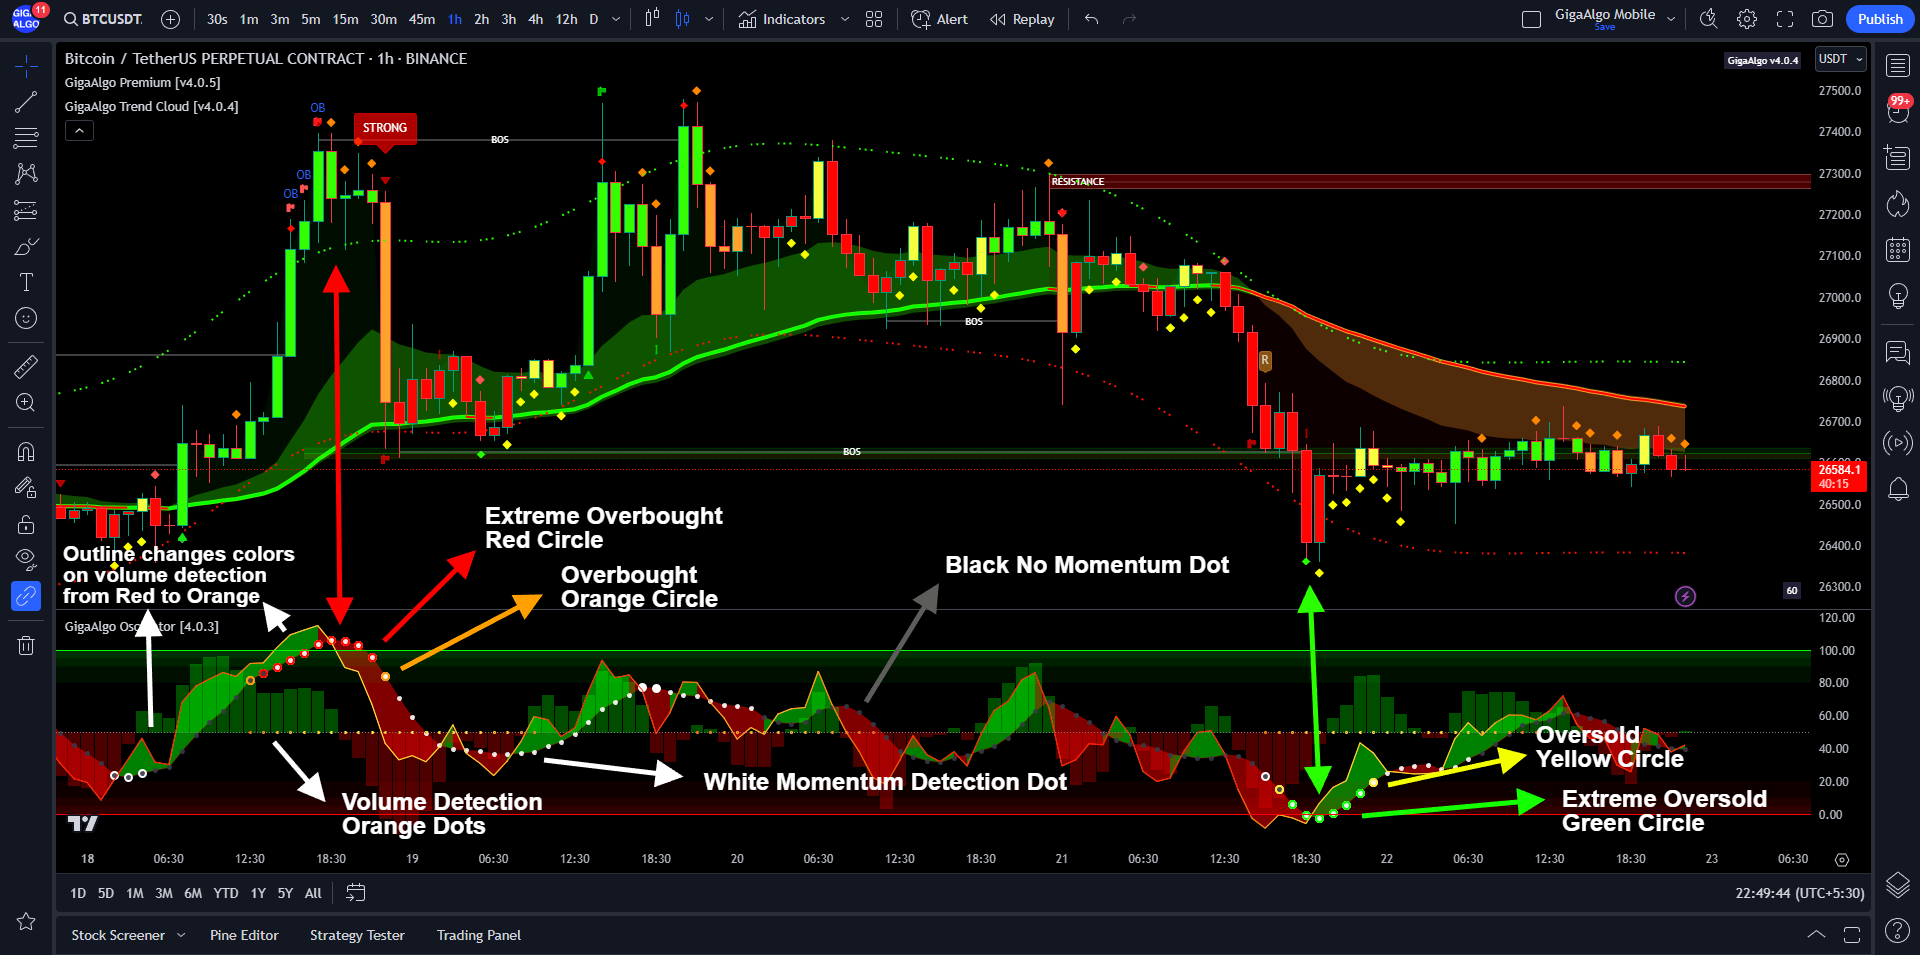
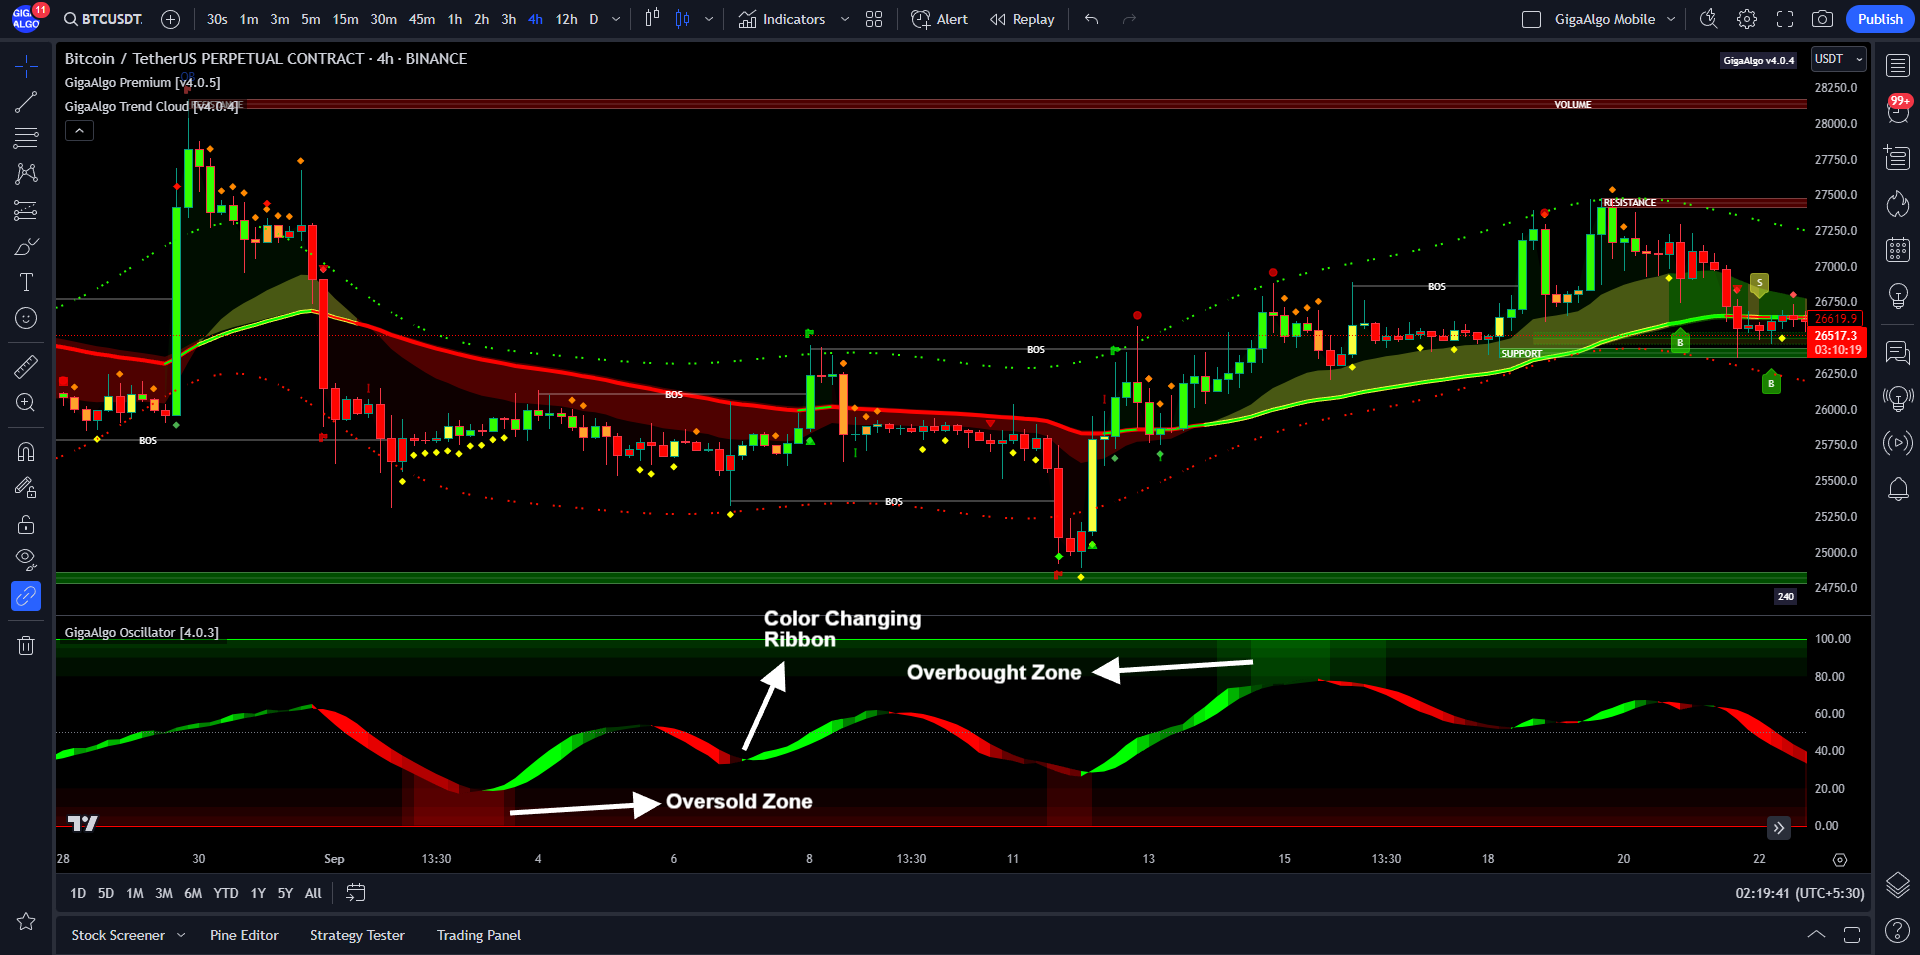
The GigaAlgo Oscillator (Default) features provide traders with valuable visual cues and signals to aid in their analysis of market momentum and potential reversals. Here’s an explanation of these features:
- Outline of Color-Changing Ribbon:
- The color-changing ribbon serves as a visual indicator of market volume. Its outline transitions from red (indicating low or no volume) to yellow when the volume is detected. This helps traders assess the level of market participation.
- Orange Dots on the Center Line of the Oscillator:
- Orange dots appearing on the center line of the oscillator signify the detection of volume. This indicates periods of heightened market activity and is an important signal for traders.
- White Little Circles Along with Ribbon:
- White little circles positioned along with the ribbon are indicative of detected momentum in the market. This suggests that price movement is significant and may signal the strength of the current trend.
- Black Little Circles Along with Ribbon:
- Black little circles, when seen along with the ribbon, imply the absence of momentum. This indicates a lack of significant price movement during that particular period.
- Orange Circles:
- Orange circles are used to identify entry into the overbought zone. The overbought zone typically suggests that the asset’s price may be overvalued, and a reversal or pullback could be imminent.
- Red Circles:
- Red circles represent the extreme overbought zone. When an asset enters this zone, it may indicate that buying pressure has become excessive, increasing the likelihood of a significant price reversal.
- Yellow Circles:
- Yellow circles are used to indicate the entry into the oversold zone. The oversold zone typically suggests that the asset’s price may be undervalued, and a reversal or rebound could be on the horizon.
- Green Circles:
- Green circles represent the extreme oversold zone. When an asset enters this zone, it may indicate that selling pressure has become excessive, raising the potential for a significant price reversal.
These visual elements and signals are valuable tools for traders to assess market conditions, detect changes in momentum, and identify potential price reversals. Traders can use these cues to make informed decisions about their trading strategies, including entry and exit points. However, it’s important to combine these signals with other technical analysis tools and risk management strategies for comprehensive trading decisions.
Here is a screenshot of the GIGA OSCILLATOR (Default) features:
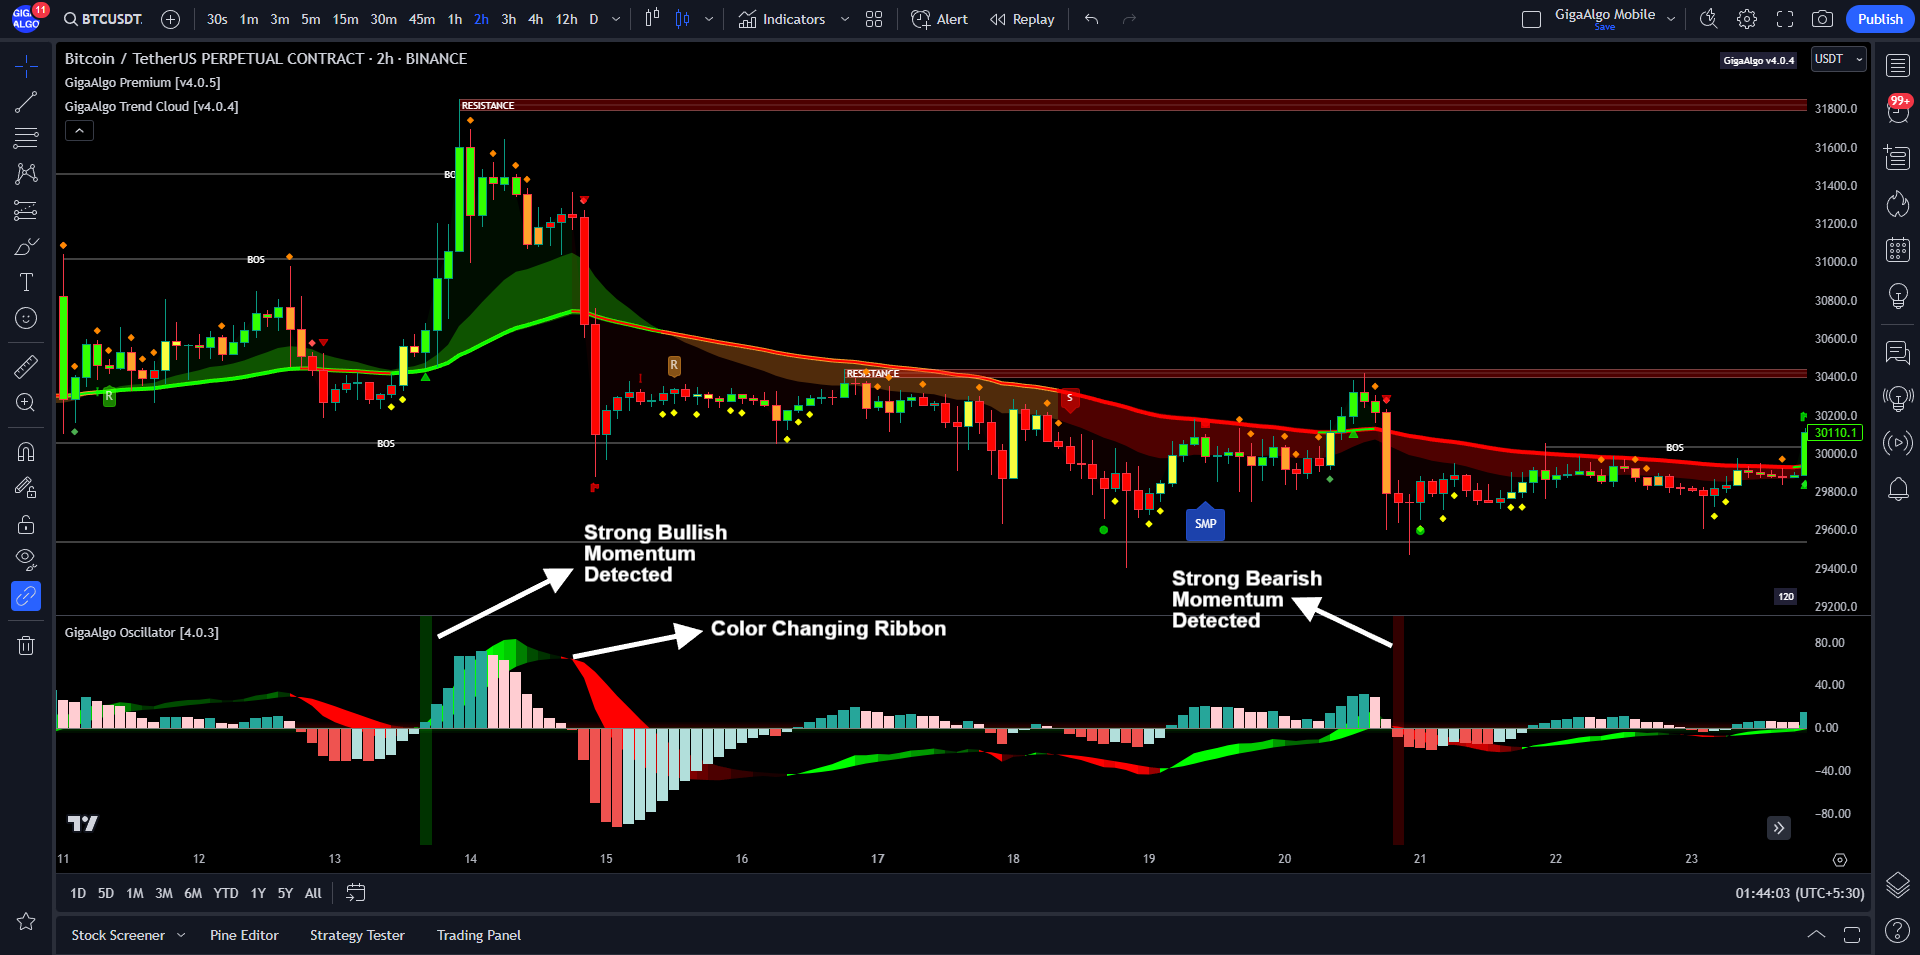
The Giga MACD (Moving Average Convergence Divergence) features provide traders with visual cues to assess market momentum and trend direction. Here’s an explanation of these features:
- Color-Changing Ribbon for MACD:
- The color-changing ribbon for the MACD serves as a visual indicator of the MACD histogram. The color may change to signify shifts in momentum and trend direction.
- Strong Green Line:
- A strong green line on the MACD represents strong bullish momentum detected in the market. This indicates that buying pressure is robust, and the price is experiencing significant upward momentum.
- Strong Red Line:
- Conversely, a strong red line on the MACD signals strong bearish momentum detected in the market. This suggests that selling pressure is dominant, and the price is experiencing significant downward momentum.
The MACD is a popular technical indicator that helps traders identify potential trend reversals and momentum shifts. The color-changing ribbon and strong green and red lines provide traders with a clear visual representation of these dynamics. Traders can use this information to make informed decisions about entering or exiting positions, as well as gauging the strength of ongoing trends. However, it’s important to use the MACD in conjunction with other technical analysis tools and strategies to form a comprehensive trading approach.
Here is a screenshot of the GIGA MACD features:
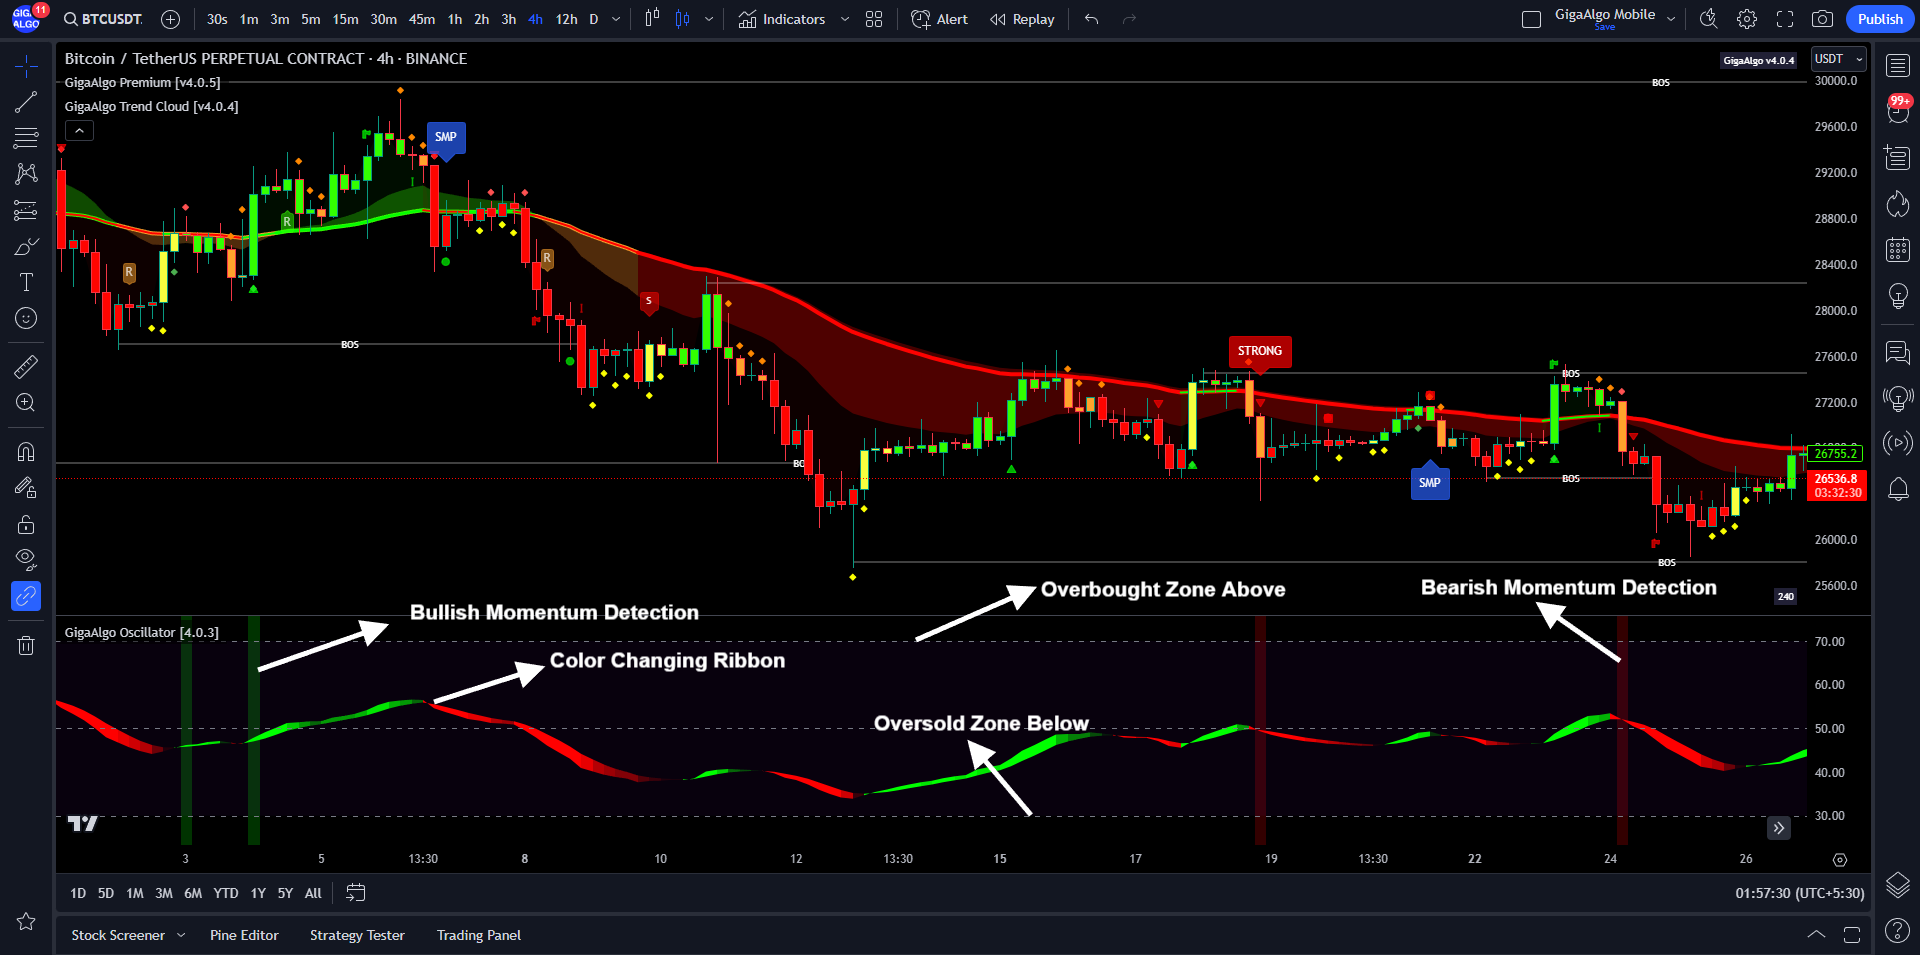
The Giga RSI (Relative Strength Index) features offer traders a visual representation of market momentum and potential overbought and oversold conditions. Here’s an explanation of these features:
- Color-Changing Ribbon for RSI:
- The color-changing ribbon for the RSI serves as a visual indicator of the RSI values. The color may change to reflect shifts in market momentum and sentiment.
- Strong Green Line:
- A strong green line on the RSI indicates strong bullish momentum detected in the market. This suggests that buying pressure is robust, and the market is in a strong uptrend.
- Strong Red Line:
- A strong red line on the RSI signals strong bearish momentum detected in the market. This implies that selling pressure is dominant, and the market is in a strong downtrend.
- Overbought and Oversold Zone Marker Lines:
- The RSI typically features two horizontal lines that mark overbought and oversold conditions.
- An overbought zone marker line is usually set at a level (often around 70) that suggests the asset may be overvalued, and a reversal or pullback could be likely.
- An oversold zone marker line is typically set at a level (often around 30) that suggests the asset may be undervalued, and a reversal or rebound could be expected.
The RSI is a widely used momentum oscillator that helps traders assess the strength and direction of market trends. The color-changing ribbon, strong green and red lines, and overbought and oversold zone markers provide traders with important visual cues for analyzing market conditions. Traders can use this information to make informed decisions about their trading strategies, including potential entry and exit points based on RSI signals and zones. However, it’s important to combine RSI analysis with other technical indicators and risk management strategies for comprehensive trading decisions.
Here is a screenshot of the GIGA RSI features:
The Giga Stochastic features provide traders with visual cues to assess market conditions and potential overbought and oversold zones. Here’s an explanation of these features:
- Color-Changing Ribbon for Stochastic RSI:
- The color-changing ribbon for the Stochastic RSI serves as a visual indicator of Stochastic RSI values. The color may change to reflect shifts in market momentum and sentiment.
- Oversold Zone Indicator (Red Background):
- When the background of the Stochastic RSI chart turns red, it indicates that the Stochastic RSI has entered the oversold zone.
- The oversold zone suggests that the asset may be undervalued, and a reversal or rebound could be likely.
- Overbought Zone Indicator (Green Background):
- When the background of the Stochastic RSI chart turns green, it indicates that the Stochastic RSI has entered the overbought zone.
- The overbought zone suggests that the asset may be overvalued, and a reversal or pullback could be likely.
- Multiple Backgrounds (Extreme Oversold or Overbought):
- If you observe multiple backgrounds, it may signify that the Stochastic RSI has entered an extreme oversold or overbought condition. This indicates a strong potential for a significant market reversal.
The Stochastic RSI is a momentum oscillator that combines elements of both the Stochastic Oscillator and the Relative Strength Index (RSI). It helps traders identify potential overbought and oversold conditions and assess the strength and direction of market trends. The color-changing ribbon and background indicators provide traders with visual cues to make informed decisions about potential entry and exit points based on Stochastic RSI signals and zones. However, as with other technical indicators, it’s important to use Stochastic RSI analysis in conjunction with other tools and strategies for comprehensive trading decisions.
Here is a screenshot of the GIGA STOCHASTIC features:
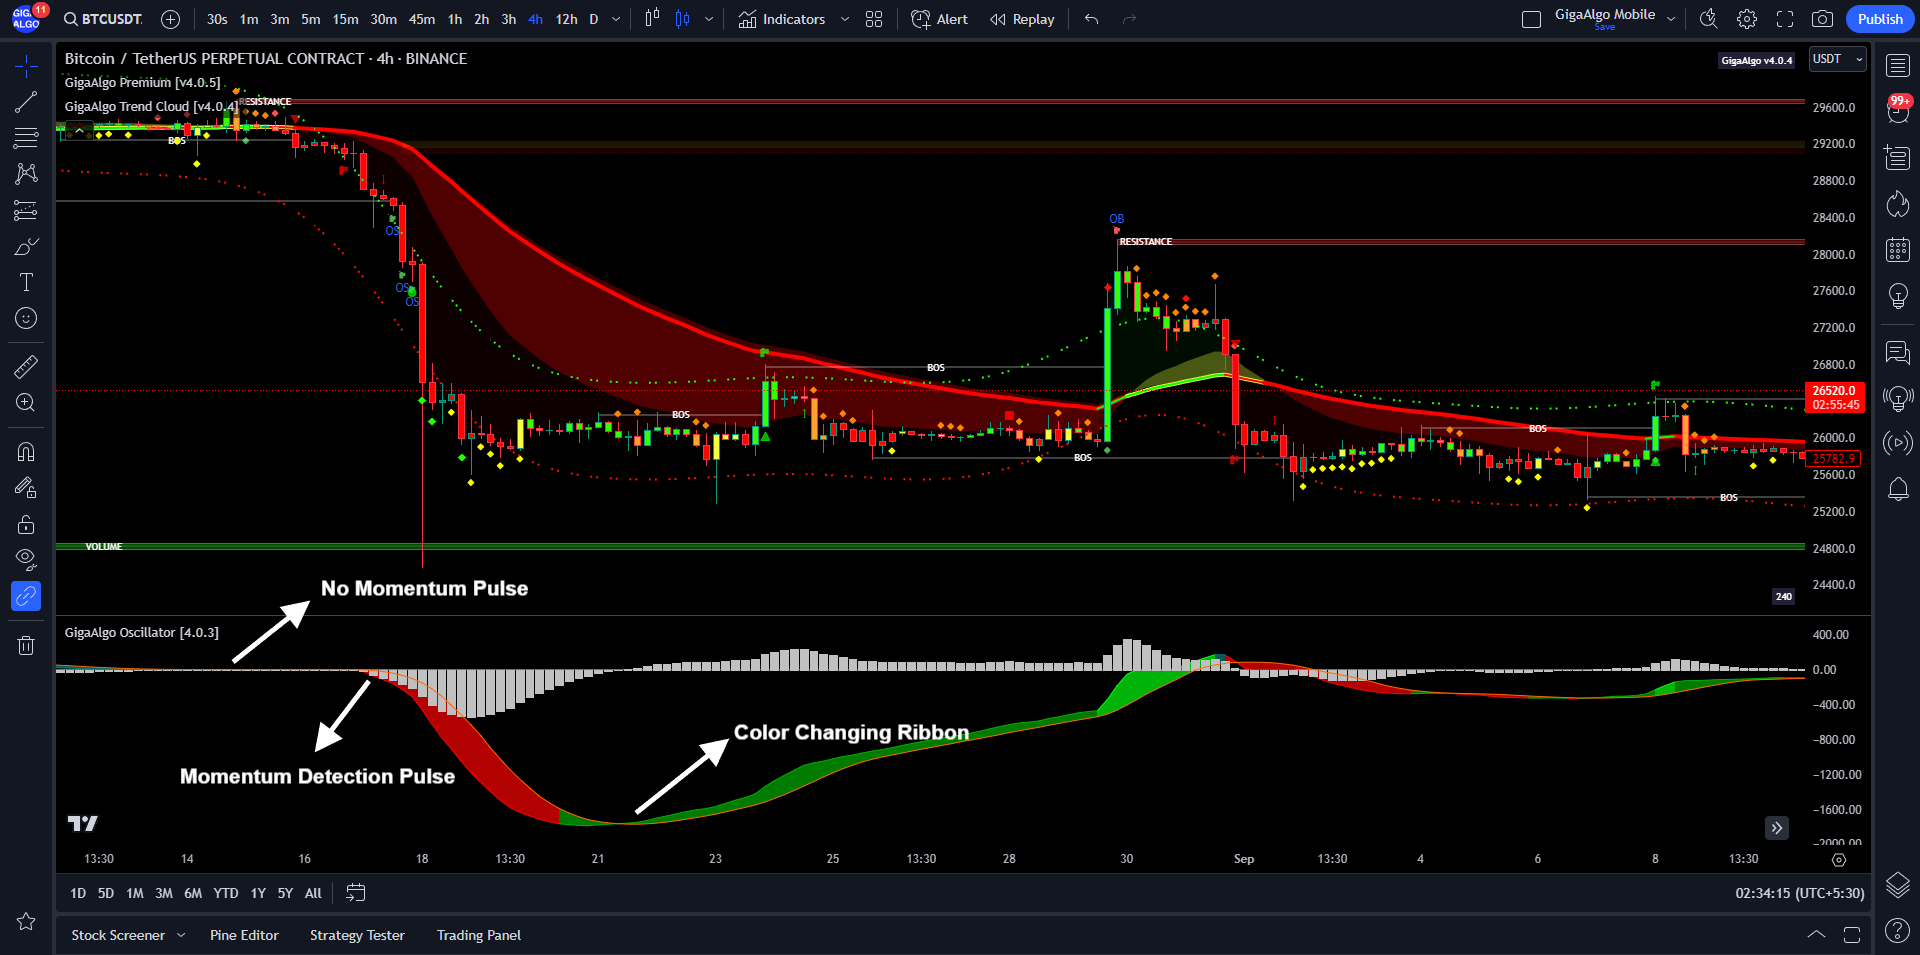
The Giga Impulse trading indicator is a valuable tool that assists traders in identifying and capitalizing on market momentum and trend shifts. Here’s a description of the key features and benefits of the Giga Impulse indicator:
Giga Impulse Features:
- Momentum Detection: The Giga Impulse indicator excels at detecting changes in market momentum. It identifies periods of both strong and weak momentum, helping traders stay attuned to evolving market conditions.
- Color-Changing Ribbon: The indicator utilizes a color-changing ribbon that visually represents shifts in market momentum. The ribbon may change colors to indicate varying degrees of momentum strength, offering traders a clear and intuitive way to assess market dynamics.
- Trade Confirmation: By providing momentum confirmation, the Giga Impulse indicator assists traders in making more informed trading decisions. When used in conjunction with other technical analysis tools, it can help confirm potential trade setups and filter out false signals.
- Entry and Exit Signals: Traders can use the Giga Impulse indicator to identify potential entry and exit points based on changes in momentum. For instance, a strong shift from red to green on the color-changing ribbon might signal a bullish entry opportunity, while a shift from green to red could indicate a bearish exit point.
- Support for Impulse Trading: Impulse trading strategies focus on capitalizing on short-term bursts of market momentum. The Giga Impulse indicator is particularly suited for traders who employ such strategies, as it provides timely and actionable signals during these momentum-driven market movements.
- Risk Management: While the Giga Impulse indicator can assist in identifying trading opportunities, it’s essential to combine its signals with sound risk management practices. Effective risk management can help traders protect their capital and mitigate potential losses.
In summary, the Giga Impulse trading indicator is a versatile tool that caters to traders seeking to capitalize on short-term market momentum and trend shifts. Its color-changing ribbon, momentum detection, and trade confirmation features provide valuable insights into market dynamics. However, it’s crucial for traders to use the Giga Impulse indicator in conjunction with other technical analysis tools, risk management strategies, and a solid trading plan for comprehensive and successful trading decisions.
Here is a screenshot of the GIGA IMPULSE features:
It’s important to note that trading strategies based on technical analysis, such as the ones described here, should be used with caution. They rely on historical price data and patterns and may not always accurately predict future price movements. Traders often use a combination of technical and fundamental analysis along with risk management strategies to make informed trading decisions. Additionally, it’s crucial to have a thorough understanding of these concepts and practice responsible risk management when trading in financial markets.